Different of Scorecard and Dashboard
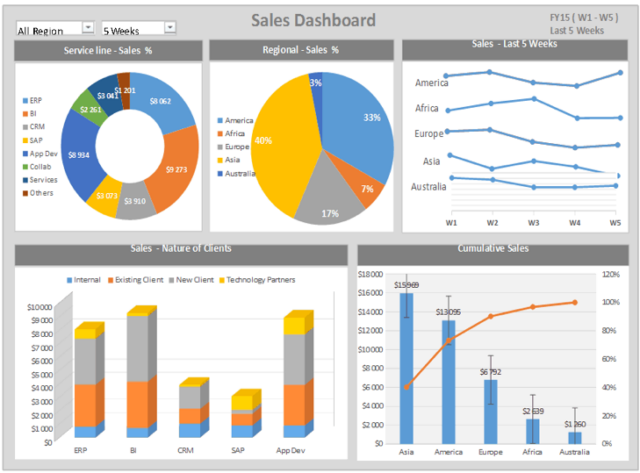
Dashboard is a real time user interface visual display presented graphically highlighting the most important information to achieve one or more objectives. These information are consolidated and arranged usually on a single screen so that the information can be monitored at a glance. It shows current status and trends of organization’s key performance indicators so that the decision makers can instantly track the status and make appropriate management decision in no time.
- For example, a Sales dashboard may show progress related to sales, revenue or profit across geographical clusters or service lines. It helps regional sales manager to track the performance of individual sales representatives and monitor the count of deals closed on real time basis.

Here are a few examples of times when a dashboard would work very well in organization:
- Need to track the efficiency of production and error rates in your manufacturing facility.
- Need to track how many inbound calls your call centers get every hour.
- Need to monitor safety and instances of injury in a factory.
- Have to track the number of on-time arrivals and departures to and from your airport.
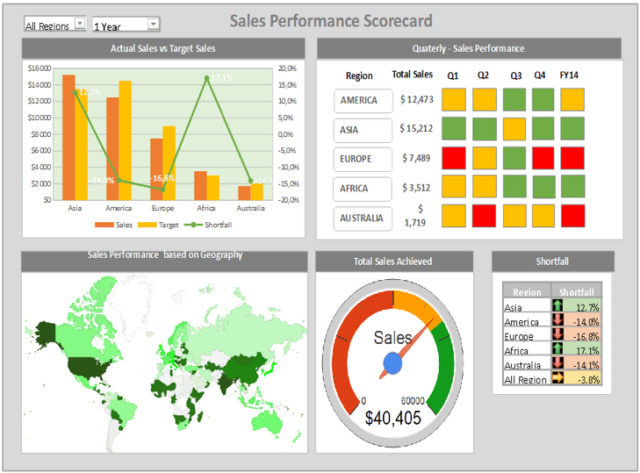
Scorecards provide visual presentation of standard key performance indicators (KPIs) that help businesses measure and manage performance. The very purpose is to keep the business focused on a common strategic plan by monitoring real world execution and mapping the results of that execution back to a specific strategy. It is used to align operational execution with business strategy. The most common scorecard used in every business is Balance Scorecard.
- For example, a Sales performance scorecard may show performance related to sales, revenue and profit against target or budget estimates. It may also highlight the shortfalls or deviations in actual figures against the estimated targets.

If any of the following scenarios similar to current situation, a scorecard may be ideal:
- Need to determine whether or not creating the right products, whether or not those products are keeping up with today’s trends, whether or not those products are profitable, and how all of those things tie into your strategy.
- Need to strategize about which call centre scripts are and are not working and how that could lead to a better customer experience.
- Need to determine what management team is doing to learn from and improve upon training and employee satisfaction.
- Need to look at how having better safety standards in place would drive a more profitable manufacturing environment.
A major difference between the dashboards and scorecards is that a scorecard focuses on a given metric and compares it to a forecast or target, whereas a dashboard will present multiple numbers in different ways. In short, a dashboard is a performance monitoring system, whereas a scorecard is a performance management system.
| Dashboard | Scorecard | |
| Purpose | Measures current activity | Chart progress |
| Users | Executives, managers, staff | Executives, managers, staff |
| Updates | “Right time” feeds | Periodic snapshots |
| Data | Events | Summaries |
| Queries | Run against remote systems | Run against local data mart |
| Display | Charts | Symbols |
Source:
https://www.whatissixsigma.net/dashboard-and-scorecard/
https://www.clearpointstrategy.com/dashboards-and-scorecards-deciding-between-operations-strategy/
https://pdfs.semanticscholar.org/1e4b/eb1abb2b0ede0d931bb854e910930a1c4399.pdf


