

About Data Blending and Steps for Blending Data in Tableau
About Data Blending and Steps for Blending Data in Tableau
Oleh: Nur Anisa
Blending data is different from joining tables. Blending data is a method for combining data from multiple sources. Blending data brings in additional information from a secondary data source and displays it with data from the primary data source directly in the view.
Unlike joins, blending data keeps the data sources separate and simply displays their information together. This is ideal when the data is at different levels of granularity. For example, you have transactional data in one source and quota data in another. If we were to join this data, some quota information would be duplicated for each transaction because joins are row-level. Instead, blending data is a better method. Each data source is queried independently, and the results are aggregated to the appropriate level then visualized together.
The key steps to data blending:
- Data Acquisition: Identify and obtain access to the data within your sources
- Joining Data: Combine the edited data for further use and analysis
- Data Cleansing: Redesign the data into a usable/functional format and correct/remove any bad data
Steps for Blending Data
Data blending is performed on a sheet-by-sheet basis and is established when a field from a second data source is used in the view. To create a blend in a workbook with at least two data sources, bring a field from one data source to the sheet—it becomes the primary data source. Switch to the other data source and use a field on the same sheet—it becomes a secondary data source.
- Ensure that the workbook has multiple data sources. The second data source should be added by going to Data > New data source.
- Drag a field to the view. Whichever data source this first field comes from will become the primary data source.
- Switch to another data source and make sure there is a relationship to the primary data source.
- If there is an orange linking field icon ( ), the data sources are automatically related. As long as there is at least one active link, the data can be blended.
- If there are gray, broken link icons ( ), click the icon next to the field that should link the two data sources. It will turn orange, representing an active relationship.
- If a link icon does not appear next to the desired field
- Drag a field into the view from the secondary data source.
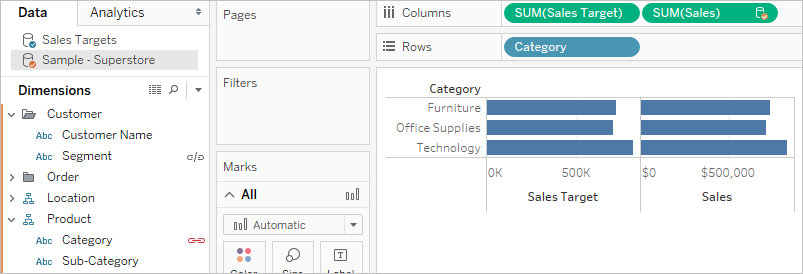
As soon as this second data source is used in the same view, a blend is established. In the example below, our primary data source is Sales Targets and the secondary data source is Sample – Superstore
- The primary data source is indicated with a blue check mark on the data source. Fields from the primary data source used in the view have no indication.
- The secondary data source is indicated with an orange check mark on the data source and an orange bar down the side of the Data pane. Fields from the secondary data source used in the view have an orange check mark.
Source:
https://www.edureka.co/blog/tableau-data-blending/
https://help.tableau.com/current/pro/desktop/en-us/multiple_connections.htm
Comments :